
If you're just getting started with digital analytics, you may also beginning your introduction to testing, aka QA (Quality Assurance). You will probably be given a document outlining where and when different analytics tags should fire and what events and variables should be set. It's all part of learning the process.
No matter how experienced you are with the process, you will always have questions. But one of the first ones you may have is how to view information in the data layer and page tag from an interaction that results in a new page loading in the same window. It's not obvious right away why this elusive information is no longer available. The page that the event data was generated on must unload for the next page to load, so all the information from that page is no longer accessible. This makes room in memory for the next page to load. It would be very inefficient to keep all this information in memory and it could also pose a security risk.
Here are two ways that you can catch that data before it slips away into oblivion.
The first is quite simple. Hold down the shift key while you click on the element. This will cause the new page to open in a separate tab, retaining your updated data layer and the new page tag in the original tab.
But sometimes this approach doesn't work. You may find that shift-clicking doesn't do anything. A good example of this is a form submission. When this happens, you can capture new data layer information and page tags in Chrome with a few more steps:
- Open your developer tools (In Windows, click Ctrl-Shift-I to quickly open the developer tools).
- Go to the sources tab.
- Access the debugger (the bottom portion of the sources tab). If you can't see it, click on the small icon in the lower-right corner to reveal the debugger.
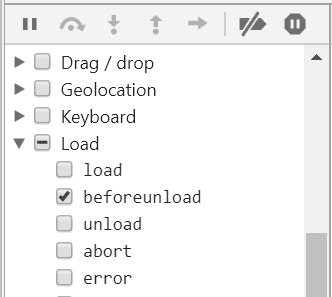
- Expand the section titled "Event Listener Breakpoints".
- Expand the section within this titled "Load".
- Check the box for "beforeunload"
- Perform the desired action.
- The page will either become dim and a play button will appear at the top or a play button will appear at the top of the debugger in the source tab.
- Inspect the data layer and page tag.
- To become unstuck, click the play button.
Other browsers may have similar tools to do this. Consult their documentation.
comments